

Revival Gold Delivers Compelling PEA Results and Attractive Potential Re-development Timeline for the Mercur Gold Project
/EIN News/ -- TORONTO, March 31, 2025 (GLOBE NEWSWIRE) -- Revival Gold Inc. (TSXV: RVG, OTCQX: RVLGF) (“Revival Gold” or the “Company”) is pleased to announce compelling results from a Preliminary Economic Assessment (“PEA”) on the Company’s Mercur Gold Project (“Mercur” or the “Project”) in Utah, U.S.A. Furthermore, the Project’s favorable mineral tenure, straightforward design and existing infrastructure endowment are expected by Revival Gold and the Company’s consultants to support a relatively short permitting timeline of approximately two years, putting Mercur on the fast track for potential re-development.
Mercur Heap Leach PEA Highlights1
- Life-of-mine (“LOM”) production of 65.6 million tonnes (“MT”) of mineralized material at 0.60 grams per tonne (“g/T”) and 75% average recovery generating an average of 95,600 ounces of gold per year over a 10-year mine life;
- After-tax NPV at a 5% discount rate (“NPV5%”) of $294 million and after-tax IRR of 27% at a gold price of $2,175 per ounce increasing to a $752 million NPV5% and 57% IRR at a gold price of $3,000 per ounce;
- After-tax payback period of 3.6 years at $2,175 per ounce of gold decreasing to 1.7 years at $3,000 per ounce of gold;
- Pre-production and working capital of $208 million and additional LOM sustaining capital of $110 million;
- LOM average cash cost of $1,205 per ounce of gold and all in sustaining cost of $1,363 per ounce of gold;
- PEA mine plan developed from Indicated Mineral Resources of 35.3 MT grading 0.66 g/T gold containing 746,000 ounces of gold and Inferred Mineral Resources of 36.2 MT grading 0.54 g/T gold containing 626,000 ounces of gold2; and,
- Expected timeline to complete applicable baseline studies and mine permitting of approximately two years.
“Completion of this PEA highlights the potential economic value of Mercur and more than doubles Revival Gold’s underlying net asset value from gold,” said Hugh Agro, President & CEO. “Mercur presents a unique opportunity for relatively near-term U.S. gold production from a low-risk, low capital project at a logistically superior domestic mine site. The Project features robust economics including a $294 million after-tax NPV and a compelling 27% after-tax IRR at $2,175 gold increasing to $752 million and 57% at $3,000 gold. Over the course of the next two years, Revival Gold intends to focus on low-risk resource conversion and expansion, additional engineering studies and the completion of Project permitting,” added Agro.
“As a brownfield site, Mercur offers significant historical exploration and operational data, excellent logistics including paved access, water supply system, electrical power line and substation, and close proximity to a large, skilled workforce, with the added benefit of exemplary historical environmental performance that should translate into a shorter permitting schedule and lower technical and execution risk,” noted John Meyer, Vice President, Engineering & Development.
This PEA is preliminary in nature. In addition to Indicated Mineral Resources, it includes Inferred Mineral Resources that are considered too speculative geologically to apply economic considerations that would enable categorization as Mineral Reserves, and there is no certainty that the PEA will be realized. Mineral Resources are not Mineral Reserves and do not have demonstrated economic viability.
The PEA was prepared in accordance with National Instrument 43-101 – Standards of Disclosure for Mineral Projects (“NI 43-101”) guidelines by Kappes, Cassiday & Associates (“KCA”) of Reno, Nevada and RESPEC Company LLC (“RESPEC”) of Reno, Nevada (the “Study Authors”) with an effective date of March 25th, 2025. The Company will file a technical report summarizing the PEA on www.revival-gold.com and on SEDAR+ at www.sedarplus.ca in accordance with NI 43-101 within 45 days.
Conference Call
Management will host a conference call later today to discuss the results of the Mineral Resource update and PEA. Call-in information is as follows:
| Scheduled Start: | March 31st, 2025, 10:00 am EST | |
| Call-In Number: | 289-514-5100 | |
| Toll Free in North America: | 800-717-1738 |
A playback of the conference call will be available for one week at 289-819-1325 or toll free in North America at 888-660-6264. Playback passcode 20300#.
Further Details
Mineral Resource Estimate
The Mineral Resource estimate is reported in accordance with NI 43-101 and was prepared by RESPEC with an effective date of March 13th, 2025.
Table 1 summarizes the pit optimization input parameters used to develop the Mineral Resource estimate and Table 2 presents the Mineral Resources for the Main and South Mercur deposits, which were estimated at a gold price of $2,000 per ounce.
Table 1: Mineral Resource Estimate Pit Optimization Input Parameters
|
Mineral Resource Pit Optimization Parameters |
Units |
Main Mercur |
South Mercur |
| General | |||
| Mineral Resource Gold Price | $/oz Au | $2,000 | |
| Mining/Heap Leaching Rate | tonnes/day | 18,144 | |
| Average Leach Recovery | % | 74% | 79% |
| Operating Expenditures | |||
| Mining – Rock | $/tonne Mined | $2.76 | |
| Mining – Fill | $/tonne Mined | $2.36 | N/A |
| Incremental Haul to Crusher | $/tonne Processed | $0.35 | $0.90 |
| Heap Leaching | $/tonne Processed | $4.46 | |
| General & Administrative Costs | $/tonne Processed | $0.90 | |
| Other Costs | |||
| Refining & Freight | $/oz Au Recovered | $5.00 | |
| Royalties | Net Smelter Return | 2.1%1 | |
|
Note: 1. Royalties for the property are variable and were calculated on a block-by-block basis. This value represents the block-weighted average net smelter return royalty for the Main and South Mercur PEA pits. | |||
Table 2: Mineral Resource Estimate
|
Project Area |
Indicated Mineral Resources | Inferred Mineral Resources | ||||
| Tonnage (kT) |
Gold Grade (g/T) |
Gold (koz) |
Tonnage (kT) |
Gold Grade (g/T) |
Gold (koz) |
|
| Main Mercur | 28,629 | 0.63 | 581.0 | 33,179 | 0.53 | 567.0 |
| South Mercur | 6,670 | 0.77 | 165.0 | 3,066 | 0.60 | 59.0 |
| Total Mercur | 35,299 | 0.66 | 746.0 | 36,246 | 0.54 | 626.0 |
|
Notes: 1. The Mineral Resource estimates were developed by Michael S. Lindholm, CPG of RESPEC in Imperial units, and the results and optimization parameters were converted into metric units. 2. In-situ Mineral Resources are classified in accordance with CIM Standards. 3. Mineral Resources for all model blocks were calculated within optimized pits at a cut-off gold grade of 0.005 oz/ton (0.17 g/tonne). 4. The average gold grades of the Mineral Resources are comprised of the weighted average of block-diluted grades within the optimized pits. Alluvium and historical waste rock and backfill materials are not included in the Mineral Resources. 5. Mineral Resources that are not Mineral Reserves do not have demonstrated economic viability. 6. Mineral Resources potentially amenable to open pit mining methods are reported using a gold price of US$2,000/oz, a throughput rate of 20,000 tons/day (18,144 tonnes/day), variable metallurgical gold recoveries that average 74% for Main Mercur and 79% for South Mercur, variable net smelter return royalties with a block-weighted average of 2.1%, mining costs of US$2.50/ton (US$2.76/tonne) mined, heap leach processing costs of US$4.05/ton (US$4.46/tonne) processed, and general and administrative costs of US$0.82/ton (US$0.90/tonne) processed. The gold commodity price was selected based on an analysis of the three-year trailing average at the end of February 2025. 7. The effective date of the Mineral Resource estimate is March 13, 2025. 8. Rounding may result in apparent discrepancies between tons, grade, and contained metal content. | ||||||
Table 3 illustrates the sensitivity of the Main and South Mercur Mineral Resources to changes in the gold price from $1,600 per ounce up to $2,400 per ounce. All sensitivity cases are tabulated at a cutoff gold grade of 0.005 oz/ton (0.17 g/tonne). All tabulations at gold prices lower than the base case of $2,000/oz represent subsets of the current Mineral Resources. All tabulations at gold prices higher than the base case reflect potential future increases in Mineral Resources and are provided for information only.
Table 3: Mineral Resources Sensitivity to Gold Price
|
Mineral Resource Category & Gold Price |
Resource Tonnage (kT) |
Contained Gold Grade (g/T) |
Contained Gold (koz) |
| Mineral Resource Sensitivity at $1,600/oz Gold | |||
| Total Indicated | 28,641 | 0.69 | 636 |
| Total Inferred | 27,611 | 0.58 | 514 |
| Mineral Resource Sensitivity at $1,800/oz Gold | |||
| Total Indicated | 31,560 | 0.67 | 683 |
| Total Inferred | 31,507 | 0.55 | 562 |
| Base Case Mineral Resource $2,000/oz Gold | |||
| Total Indicated | 35,299 | 0.66 | 746 |
| Total Inferred | 36,246 | 0.54 | 626 |
| Mineral Resource Sensitivity at $2,200/oz Gold | |||
| Total Indicated | 37,089 | 0.65 | 779 |
| Total Inferred | 39,022 | 0.52 | 654 |
| Mineral Resource Sensitivity at $2,400/oz Gold | |||
| Total Indicated | 40,238 | 0.64 | 822 |
| Total Inferred | 43,901 | 0.53 | 743 |
|
Notes:1. The Mineral Resource estimates were developed by Michael S. Lindholm, CPG of RESPEC in Imperial units, and the results and optimization parameters were converted into metric units. 2. In-situ Mineral Resources are classified in accordance with CIM Standards. 3. The base case reported Mineral Resources at a gold price of $2,000/oz Au is shown in bold and has an effective date of March 13, 2025. 4. Tabulations at gold prices higher and lower than the base case are presented to demonstrate sensitivities to fluctuating gold prices. 5. Tabulations comprise all model blocks at a cutoff gold grade of 0.005 oz/ton (0.17 g/tonne) for all material within optimized pits at variable gold prices. Pit optimizations used a throughput rate of 20,000 tons/day (18,144 tonnes/day), assumed variable metallurgical gold recoveries that average 74% for Main Mercur and 79% for South Mercur, variable net smelter return royalties with a block-weighted average of 2.1%, mining costs of US$2.50/ton (US$2.76/tonne) mined, heap leach processing costs of US$4.05/ton (US$4.46/tonne) processed, general and administrative costs of $0.82/ton (US$0.90/tonne) processed. 6. Tabulations at gold prices lower than the base case of $2,000/oz Au represent subsets of the current Mineral Resources. 7. Tabulations at gold prices higher than the base case reflect the potential for increased Mineral Resources and are provided for information only. 8. The average grades of the tabulations are comprised of the weighted average of block-diluted grades within the optimized pits. Alluvium, dump and backfill materials are not included in the tabulations. 9. Mineral Resources that are not Mineral Reserves do not have demonstrated economic viability. 10. Rounding may result in apparent discrepancies between tons, grade, and contained metal content. | |||
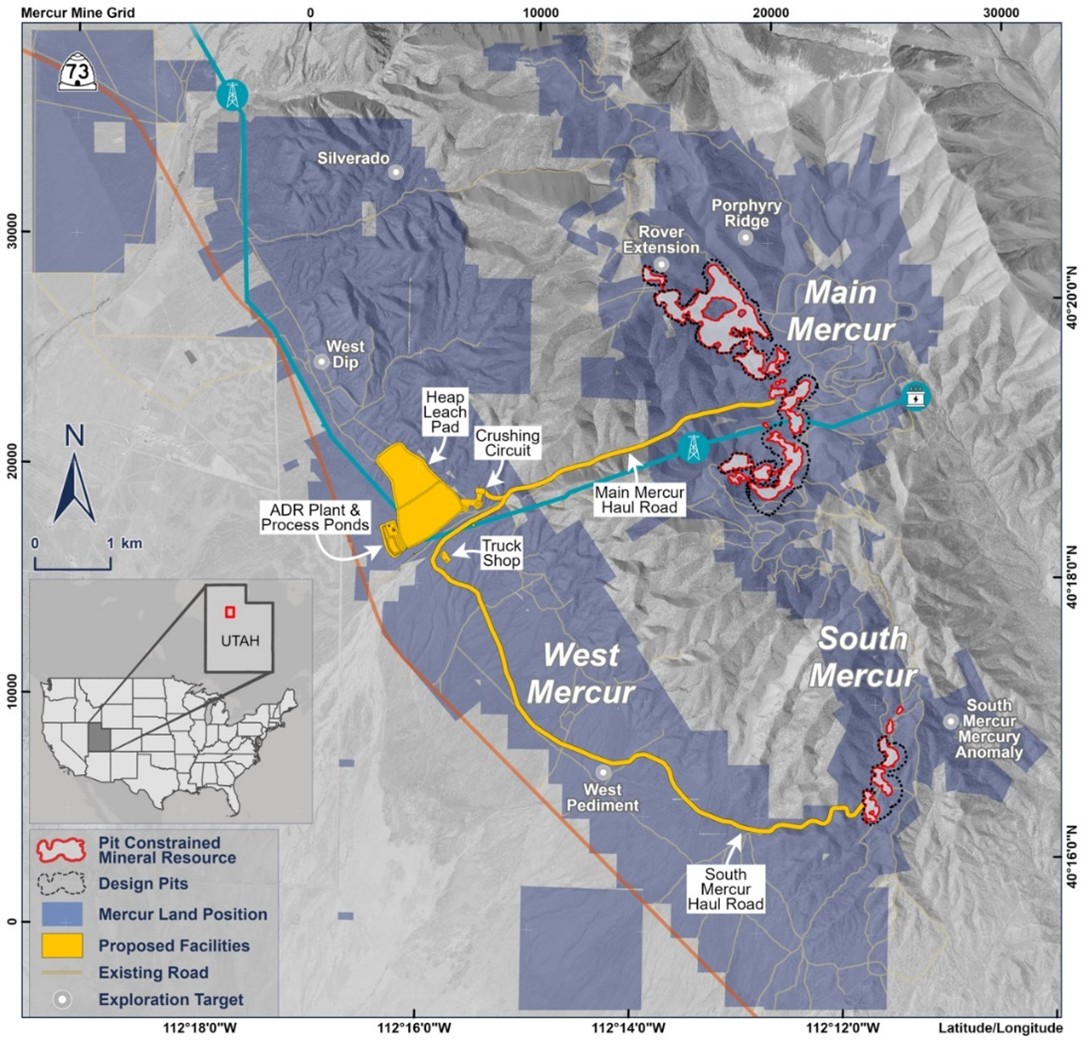
Figure 1 presents an overview map for the Mercur Project area and the location of reported Mineral Resources, exploration targets, key existing infrastructure, and proposed new facilities on the property.
Figure 1: Overview Map
Open Pit Heap Leach PEA
The PEA was developed using conventional open pit hard rock mining methods at a nominal rate for mineralized material of 18,144 tonnes/day. The PEA mine fleet is conventional with loading accomplished by a 22 m3 hydraulic shovel and a 23 m3 front loader matched to up to sixteen 136-tonne class haul trucks.
During the initial four years of operations, mining would be expected to be undertaken concurrently at both the Main Mercur and South Mercur pits. The run-of-mine (“ROM”) mineralized material would be hauled to the proposed West Mercur plant site area then crushed, conveyor stacked and leached on a dedicated leach pad. During the last six years of operations, mining would be expected to be undertaken at Main Mercur only. The LOM average strip ratio for the Project is 2.8.
ROM mineralized material from the open pits would be processed in a conventional stationary three-stage crushing circuit to achieve a particle size of 100% passing 13 mm (0.5 inch). Crushed-product would be stacked in 10-meter-high lifts on a heap leach facility located at West Mercur and leached with a low-concentration cyanide solution using a buried drip irrigation system. The resulting pregnant leach solution would be processed in an adsorption-desorption-recovery (“ADR”) plant for the recovery of gold resulting in the production of a final doré product.
LOM average metallurgical recovery for the Project is approximately 75% of contained gold and the estimated average annual gold production would be 95,600 ounces per year. The estimated average recovery reflects average recoveries of 74% for Main Mercur and 79% for South Mercur. Table 4 presents the mine and gold production schedule.
Table 4: Mining and Heap Leaching Schedule
| Parameter | Units | Yr -1 | Yr 1 | Yr 2 | Yr 3 | Yr 4 | Yr 5 | Yr 6 | Yr 7 | Yr 8 | Yr 9 | Yr 10 | Totals | ||||||||||||
| Mineralized Rock |
Pit to Stockpile | M tonnes | 0.9 | 2.5 | 2.7 | 2.6 | 2.9 | 3.7 | 2.8 | 2.6 | 3.5 | 2.3 | 1.6 | 28.2 | |||||||||||
| Pit to Crusher | M tonnes | - | 4.3 | 4.0 | 3.9 | 4.2 | 5.4 | 2.8 | 4.8 | 3.8 | 3.0 | 1.2 | 37.5 | ||||||||||||
| Total Mined | M tonnes | 0.9 | 6.8 | 6.7 | 6.5 | 7.2 | 9.2 | 5.6 | 7.4 | 7.3 | 5.3 | 2.8 | 65.6 | ||||||||||||
| Crusher to Heap | M tonnes | - | 6.3 | 6.6 | 6.6 | 6.6 | 6.6 | 6.6 | 6.6 | 6.6 | 6.6 | 6.3 | 65.6 | ||||||||||||
| Gold Grade | g/tonne | - | 0.58 | 0.52 | 0.57 | 0.59 | 0.43 | 0.57 | 0.64 | 0.66 | 0.87 | 0.72 | 0.60 | ||||||||||||
| Contained Gold | k oz | - | 128 | 124 | 110 | 121 | 125 | 91 | 122 | 136 | 141 | 177 | 1,275 | ||||||||||||
| Recovery | % | - | 84 | % | 79 | % | 76 | % | 77 | % | 76 | % | 74 | % | 80 | % | 78 | % | 71 | % | 58 | % | 75 | % | |
| Recoverable Gold | k oz | - | 107 | 98 | 84 | 94 | 95 | 68 | 98 | 106 | 100 | 102 | 951 | ||||||||||||
| Waste Rock |
Rock to Dumps | M tonnes | 0.9 | 18.7 | 17.2 | 17.0 | 14.3 | 17.2 | 19.6 | 16.6 | 15.9 | 15.2 | 3.8 | 156.3 | |||||||||||
| Fill to Dumps | M tonnes | 0.6 | 3.1 | - | - | 0.1 | 0.4 | 0.4 | 1.7 | 10.6 | 7.5 | 0.2 | 24.5 | ||||||||||||
| Total to Dumps | M tonnes | 1.4 | 21.8 | 17.2 | 17.0 | 14.4 | 17.6 | 20.0 | 18.3 | 26.4 | 22.7 | 4.1 | 180.8 | ||||||||||||
| All Rock |
Total Mined | M tonnes | 2.3 | 28.6 | 23.9 | 23.5 | 21.5 | 26.8 | 25.6 | 25.7 | 33.7 | 28.0 | 6.9 | 246.5 | |||||||||||
| Strip Ratio | wr:mr | 1.7 | 3.2 | 2.6 | 2.6 | 2.0 | 1.9 | 3.6 | 2.5 | 3.6 | 4.3 | 1.4 | 2.8 | ||||||||||||
|
Notes: 1. This PEA mine production schedule shows “Mineralized Rock” based on the contained Indicated and Inferred Resources. This is meant only to allow calculation of the cash-flow value and does not imply that any economics will be realized from the mining of the leachable material. 2. Tabled figures may not add due to rounding. | |||||||||||||||||||||||||
Infrastructure
Some of the infrastructure from the original Mercur mining operation remains in serviceable condition. Wherever possible, refurbishment and reuse of the existing infrastructure is planned, including the following:
- Site access and onsite roads;
- Water supply system;
- Fencing and gates;
- Groundwater monitoring wells;
- Stormwater management systems;
- Office building; and,
- Power substation and overhead power distribution lines.
All other major infrastructure from the previous operations were removed as part of prior site reclamation efforts and would need to be replaced for future operations. The primary new infrastructure that would be required to support the PEA plan include:
- Crushing and conveyor stacking systems;
- Process solution distribution and collection systems;
- Heap leach pad;
- Process solution and overflow ponds;
- ADR plant/laboratory;
- Main and South Mercur haul roads;
- Water and power supply to the West Mercur area;
- Truck shop and warehouse; and,
- Administration and additional office buildings.
Capital and Operating Cost Estimates
Processing, infrastructure and general and administrative (“G&A”) capital and operating cost estimates for the Mercur PEA were developed by KCA. Mining equipment, mining preproduction and mine operating cost estimates were developed by RESPEC. Capital and operating costs were estimated based on first quarter 2025 US dollars.
Capital costs for most major equipment were estimated from one or more new supplier quotes or recent quotes for similar items. Table 5 provides a summary of the PEA capital costs. The estimating cost accuracy for the study is +/-35% (AACE Class 5). Rows and columns may not be added precisely due to rounding.
Table 5: Capital Cost Estimate
| Description | Costs ($,000) | |||
| Pre-Production Capital | ||||
| Process & Infrastructure (including spare parts) | $115,036 | |||
| Mining Capital & Mining Pre-Production | $32,586 | |||
| Indirect & Owner's Costs | $4,258 | |||
| Engineering, Procurement & Construction Management | $13,804 | |||
| Contingency | $28,753 | |||
| Total Pre-Production Capital | $194,439 | |||
| Working Capital & Initial Fills | ||||
| Mining Working Capital | $9,343 | |||
| Process Working Capital | $3,782 | |||
| G&A Working Capital | $567 | |||
| Initial Fills | $201 | |||
| Total Working Capital | $13,893 | |||
| Total Pre-Production & Working Capital | $208,331 | |||
| Sustaining Capital | ||||
| Process & Infrastructure | $13,496 | |||
| Indirect & EPCM | $2,024 | |||
| Mining | $87,132 | |||
| Contingency | $7,461 | |||
| Total Sustaining Capital | $110,113 | |||
| Reclamation & Closure Allowance (Gross) | $39,790 | |||
| LOM Total Capital Costs (Excluding Working Capital) | $344,342 | |||
Processing and G&A costs were estimated by KCA from first principles. Labor costs were estimated using project-specific staffing, salary, wage, and benefit requirements. Unit consumption of materials, supplies, power, water and delivered supply costs were also estimated. The operating costs are based upon the ownership of all process production equipment and site facilities, including the onsite laboratory. Revival Gold would employ and direct all process operations, maintenance, and support personnel for all site activities.
Mining costs provided by RESPEC are based on owner mining costs using leased mining equipment. Leases are based on a five-year term; consequently, all leased equipment would be owned by Revival Gold before the end of mining operations.
Economic Analysis
Based on the estimated production schedule, capital costs and operating costs, a cash flow model was prepared by KCA for the economic analysis of the Project. All information used in this economic evaluation was derived from work completed by KCA and RESPEC, with support by Revival Gold.
Project economics were evaluated using a discounted cash flow method that measures the before-tax and after-tax Net Present Value (“NPV”) of future cash flow streams. The PEA economic model was based on the following key assumptions:
- A gold price of $2,175 per ounce.
- The mine production schedule developed by RESPEC with a nominal mining and processing rate of 18,144 tonnes per day.
- A period of analysis of 15 years that includes one year of investment and pre-production, 10 years of production, and four years for reclamation and closure.
- Capital and operating costs as summarized in Table 6 and described in the preceding section.
Project economics are based on criteria from the cash flow model that are summarized in Table 6.
Table 6: Economic Analysis Summary
| Financial Parameters | Results | ||
| Internal Rate of Return (IRR), Pre-Tax | 30.8% | ||
| Internal Rate of Return (IRR), After-Tax | 26.5% | ||
| Average Annual Cashflow (Pre-Tax) | $83 | million | |
| NPV @ 5% (Pre-Tax) | $373 | million | |
| Average Annual Cashflow (After-Tax) | $71 | million | |
| NPV @ 5% (After-Tax) | $294 | million | |
| Gold Price Assumption (US$/ounce Au) | $2,175 | /ounce Au | |
| Pay-Back Period (Years based on After-Tax) | 3.6 | years | |
| Capital Costs (Sales Tax Included) | |||
| Initial Capital | $194 | million | |
| Working Capital & Initial Fills | $14 | million | |
| LOM Sustaining Capital | $110 | million | |
| Reclamation & Closure (Gross) | $40 | million | |
| Operating Costs (Average LOM) | |||
| Mining | $11.44 | /tonne processed | |
| Processing & Support | $4.63 | /tonne processed | |
| G&A | $0.69 | /tonne processed | |
| All-in Sustaining Cost | $1,363 | /ounce Au | |
| Cash Cost | $1,205 | /ounce Au | |
| Production Data | |||
| Life of Mine | 9.95 | Years | |
| Process Throughput, average | 18,144 | tonnes/day | |
| Metallurgical Recovery Au (Overall) | 75% | ||
| Average Annual Gold Production | 95,600 | ounces Au | |
| Total Gold Produced | 951,000 | ounces Au | |
| LOM Strip Ratio (Waste Rock : Mineralized Rock) | 2.8 | ||
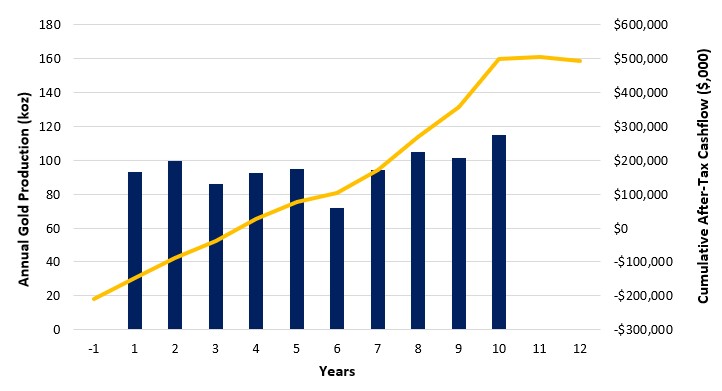
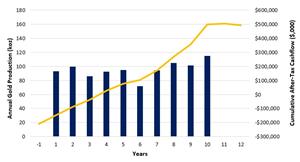
Figure 2 presents the estimated annual gold production and cumulative after-tax cash flow from pre-production through mine closure at $2,175 per ounce of gold.
Figure 2: Annual Gold Production and Cumulative After-Tax Cash Flow
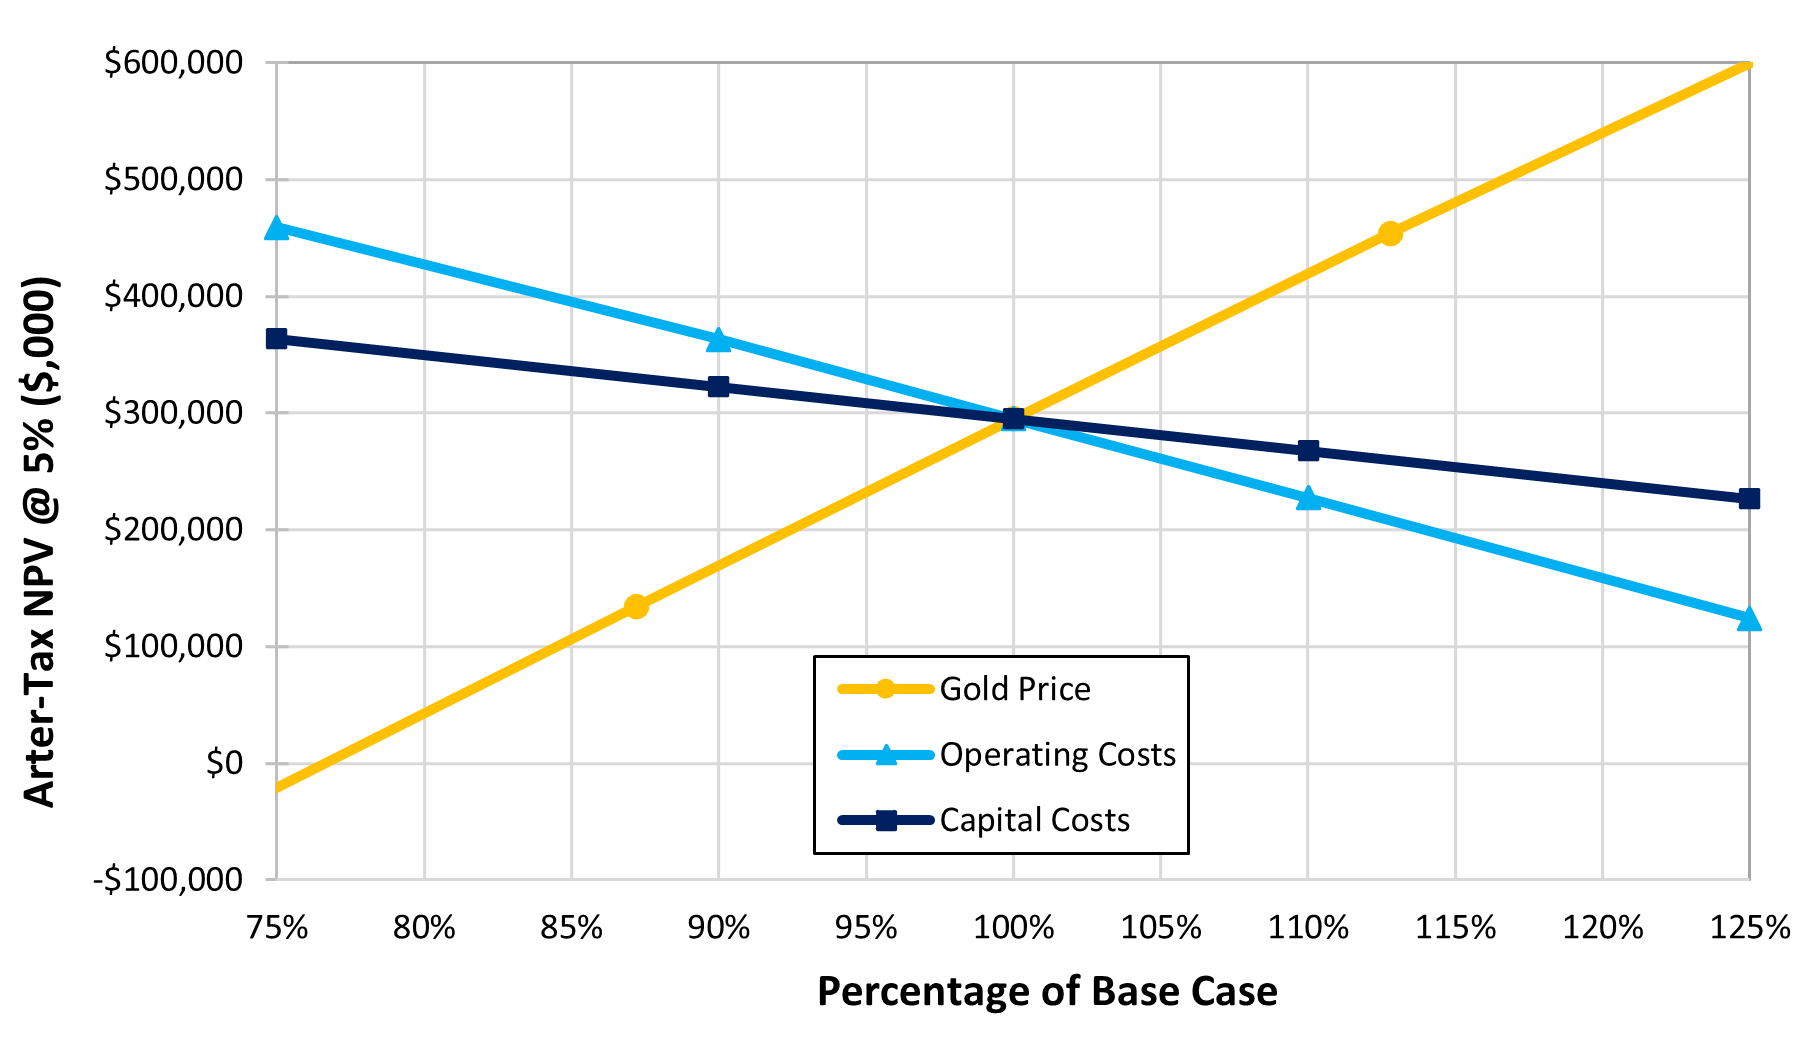
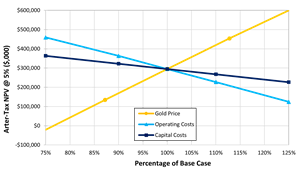
A sensitivity analysis was performed using the PEA economic model. Figure 3 and Figure 4 provide the after-tax IRR and after-tax NPV5% sensitivities to gold price, capital cost, and operating cost, respectively.
Figure 3: After-Tax IRR Sensitivity Analysis
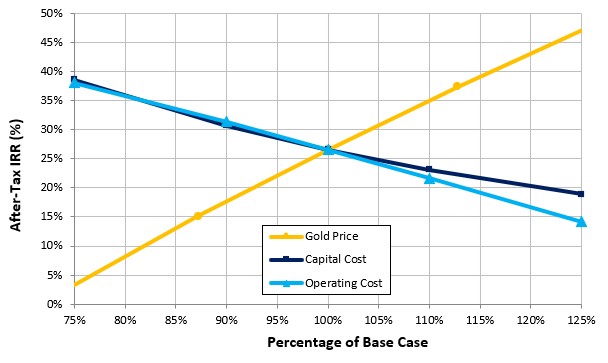
Figure 4: After-Tax NPV5% Sensitivity Analysis
Mine Permitting
The primary mine permitting activity for the Project would be managed by the State of Utah Department of Natural Resources Division of Oil, Gas and Mining (“DOGM”) in the form of a Notice of Intention to Commence Large Mining Operations and Reclamation Plan (R647-4-103). DOGM specialists would coordinate baseline studies and determine project impacts and mitigation measures beyond those proposed and carried out by the proponent. Baseline studies that would be required for the Project include cultural, wildlife and plant special status species, and noxious weed surveys and desk top analysis. DOGM would interact with other agencies including the Utah Department of Environmental Quality, who oversees Air Quality and Water Quality permits and approvals, the Utah Division of Water Rights and Water Quality (underground discharge permits), and the Utah Trust Lands Administration who manages School and Institutional Trust Lands Administration (“SITLA”). DOGM would provide analyses of sensitive resources on SITLA lands subject to leasing or royalty interests.
The critical path permitting activities for the Project would be associated with the Bureau of Land Management (“BLM”) for limited rights-of-way (“ROWs”) on BLM-administered land. The water supply pipeline and haul road ROWs would be analyzed with an Environmental Assessment (“EA”). State of Utah permits would be completed concurrently with the ROWs and the mine permitting process is expected to be completed in approximately two years.
Key Opportunities & Risks
Key opportunities identified by the Study Authors include:
- Low-risk infill and step-out exploration drilling at Main and South Mercur to upgrade and potentially expand the Mineral Resources.
- New potential discoveries from exploration targets within the highly prospective 6,628-hectare land position could extend the Project’s mine life. Specific targets include South Mercur en echelon structures (where an adit into the favorable Lower Great Blue unit returned anomalous mercury and gold), the Porphyry Ridge target area (including an extension of the Rover Fault), and various targets in the West Mercur area including West Dip (where previous drilling intersected 2.87 g/T gold over 13.7 meters), Silverado and West Pediment.
- Crushing and heap leaching the historical Main Mercur Barrick ROM heap leach material and historical South Mercur underground tailings.
- Potential to increase the production rate with the discovery of additional mineral resources amenable to heap leach recovery.
- Review and extraction of additional historical data to potentially improve the geological, geotechnical, metallurgical, and hydrogeological understanding of the site.
Likewise, the Study Authors identified several risks that could negatively impact Project economics:
- Samples used for the column leach tests were derived from a limited number of core holes that do not represent the full range of metallurgical behavior of the Mercur mineral resources. Additional drilling, sampling and testing will be required to increase confidence in the heap leach recovery estimates to support a Preliminary Feasibility Study (“PFS”) and continued Project development.
- Although not considered significant, the tonnage of material mined from the historical underground mining activity has not been accounted for in the Mineral Resource estimate. Subsequent drilling and modeling near the historical underground working areas is required and may negatively impact the size and grade of the mineral resources.
- The Mercur mine pits have known carbonaceous material that could impact overall heap performance if this material is not well understood and managed in any future operation. Steps have been taken to identify this material, and the PEA mine schedule was developed such that the material is stockpiled and leached at the end of mine life.
- Some uncertainty remains in the post-mining surface in areas that were backfilled with waste rock and reclaimed during the prior operation. Additional drilling and geophysical data will be required to convert associated Mineral Resources in these areas from the Inferred to the Indicated category.
- Geotechnical studies are required to verify the pit slope assumptions for both Main and South Mercur.
- The Mercur land position includes claim interests optioned from Barrick Resources (USA) Inc. and others and require future lease fees and earn-in payments.
Next Steps
The Study Authors have recommended additional work to increase the level of detail, potentially improve the PEA economics, and de-risk certain aspects of the Project. These recommendations have been separated into core items that support moving the Project forward by completing a PFS, and discretionary items such as some exploration and Project permitting activities. A summary of the recommendations include:
- Completing additional RC drilling, core drilling, and geophysics in the Main and South Mercur Inferred Mineral Resource areas to increase confidence in and expand the existing resource and collect samples for metallurgical and geotechnical testing.
- Explore for potential new discoveries from exploration targets within the highly prospective 6,628-hectare land position that could extend the LOM.
- Undertake additional heap leach metallurgical testing including column leach and compacted permeability tests to determine the optimum crush size, increase confidence in the recovery model for a range of rock types including potentially carbonaceous and sulfidic materials, and validate the reagent requirements.
- Complete foundation geotechnical studies in the key infrastructure areas at West Mercur.
- Initiate wildlife and cultural baseline studies to supplement existing data and compress the permitting schedule.
- A PFS should be completed on the Project once supporting lab and field studies referenced above have been sufficiently advanced, and the Mineral Resource estimate has been updated.
Table 7 provides a cost estimate for these activities.
Table 7: Estimated Costs for Recommended Next Steps
|
Recommendations |
Estimated Costs | |
|
Core Items ($ millions) |
Discretionary ($ millions) |
|
| Resource Conversion Core Drilling – Phase 1 (±4,600 m) | $3.09 | - |
| Resource Conversion Core Drilling – Phase 2 (±800 m) | $0.54 | - |
| Resource Conversion RC Drilling – Phase 1 (±10,200 m) | $1.73 | - |
| Resource Conversion RC Drilling – Phase 2 (±5,600 m) | $0.95 | - |
| Geophysics to Define Bedrock/Backfill Contact | $0.20 | - |
| Resource Expansion Core Drilling (±2,300 m) | - | $1.55 |
| Resource Expansion RC Drilling (±2,600 m) | - | $0.44 |
| Exploration RC Drilling (±3,700 m) | - | $0.63 |
| Mineral Resource Estimating | $0.20 | - |
| PFS Open Pit Geotechnical Program | $0.50 | |
| PFS Metallurgical Program | $0.30 | - |
| PFS Foundation Geotechnical Program | $0.30 | - |
| PFS Design & Financial Analysis | $1.00 | - |
| Baseline Environmental Studies | $0.15 | $0.30 |
| Totals | $8.96 | $2.92 |
Independent Qualified Persons
The PEA was prepared for Revival Gold by independent Qualified Persons (“QPs”) under NI 43-101 from KCA of Reno, Nevada and RESPEC of Reno, Nevada. The independent QPs have reviewed and approved the economic and technical information of this news release derived from sections of the PEA that they are responsible for preparing, and are named below:
- Mr. Caleb Cook, P.E. – KCA
- Mr. Michael S. Lindholm, C.P.G. Principal Resource Geologist – RESPEC
- Mr. Jordan Anderson, RM SME – RESPEC
Other technical information included in this news release was reviewed and approved by Mr. John Meyer, P.Eng., a QP and Vice President, Engineering and Development for the Company, and Mr. Dan Pace, RM SME, a QP and Chief Geologist for the Company. All QPs have conducted site visits of the Mercur property.
Further details on the PEA and the complete PEA study document can be found on the Company’s website www.revival-gold.com or www.sedarplus.ca within 45 days of this news release.
About Revival Gold Inc.
Revival Gold is one of the largest, pure gold mine developers in the United States. The Company is advancing development of the Mercur Gold Project in Utah and mine permitting preparations and ongoing exploration at the Beartrack-Arnett Gold Project located in Idaho. Revival Gold is listed on the TSX Venture Exchange under the ticker symbol “RVG” and trades on the OTCQX Market under the ticker symbol “RVLGF”. The Company is headquartered in Toronto, Canada, with its exploration and development office located in Salmon, Idaho.
For further information, please contact:
Hugh Agro, President & CEO or Lisa Ross, Vice President & CFO
Telephone: (416) 366-4100 or Email: info@revival-gold.com
Cautionary Statement
Neither the TSX Venture Exchange nor its Regulation Services Provider (as that term is defined in the policies of the TSX Venture Exchange) accepts responsibility for the adequacy or accuracy of this release.
This press release contains "forward-looking information" within the meaning of applicable Canadian securities legislation and "forward-looking statements" within the meaning of the U.S. Private Securities Litigation Reform Act of 1995 (collectively, "forward-looking statements"). Forward-looking statements are not comprised of historical facts. Forward-looking statements include estimates and statements that describe the Company’s future plans, objectives or goals, including words to the effect that the Company or management expects a stated condition or result to occur. Forward-looking statements may be identified by such terms as “believes”, “anticipates”, “expects”, “estimates”, “may”, “could”, “would”, “will”, or “plan”. Since forward-looking statements are based on assumptions and address future events and conditions, by their very nature they involve inherent risks and uncertainties. Although these statements are based on information currently available to the Company, the Company provides no assurance that actual results will meet management’s expectations. Risks, uncertainties, and other factors involved with forward-looking statements could cause actual events, results, performance, prospects, and opportunities to differ materially from those expressed or implied by such forward-looking statements.
Forward-looking statements in this news release include, but are not limited to, statements regarding the results of the PEA on the Project, such as future estimates of internal rates of return, net present value, future production, estimates of cash cost, proposed mining plans and methods, mine life estimates, cash flow forecasts, metal recoveries, estimates of capital and operating costs, timing for permitting and environmental assessments, timing, completion and results of feasibility studies, and the size and timing of phased development of the Project. Furthermore, forward-looking statements are necessarily based upon a number of estimates and assumptions that, while considered reasonable by the Company as of the date of such statements, are inherently subject to significant business, economic and competitive uncertainties and contingencies. With respect to this specific forward-looking information concerning the development of the Project, the Company has based its assumptions and analysis on certain factors that are inherently uncertain. Uncertainties include: (i) the adequacy of infrastructure; (ii) geological characteristics; (iii) metallurgical characteristics of the mineralization; (iv) the ability to develop adequate processing capacity; (v) the price of gold, silver and other commodities; (vi) the availability of equipment and facilities necessary to complete development; (vii) the cost of consumables and mining and processing equipment; (viii) unforeseen technological and engineering problems; (ix) natural disasters and/or accidents; currency fluctuations; (xi) changes in regulations; (xii) the compliance by and/or key suppliers with terms of agreements; (xiii) the availability and productivity of skilled labour; (xiv) the regulation of the mining industry by various governmental agencies, including permitting and environmental assessments; (xv) the ability to raise sufficient capital to develop such projects; (xiv) changes in project scope or design; and (xvi) political factors.
This release also contains references to estimates of mineral resources. The estimation of mineral resources is inherently uncertain and involves subjective judgments about many relevant factors. Mineral resources that are not mineral reserves do not have demonstrated economic viability. The accuracy of any such estimates is a function of the quantity and quality of available data, and of the assumptions made and judgments used in engineering and geological interpretation (including estimated future production from the Project, the anticipated tonnages and grades that will be mined and the estimated level of recovery that will be realized), which may prove to be unreliable and depend, to a certain extent, upon the analysis of drilling results and statistical inferences that may ultimately prove to be inaccurate. Mineral resource estimates may have to be re-estimated based on: (i) fluctuations in commodities prices; (ii) results of drilling, (iii) metallurgical testing and other studies; (iv) proposed mining operations, including dilution; (v) the evaluation of mine plans subsequent to the date of any estimates; and (vi) the possible failure to receive required permits, approvals and licenses or changes to existing mining licenses.
Forward-looking statements and information involve significant known and unknown risks and uncertainties, should not be read as guarantees of future performance or results and will not necessarily be accurate indicators of whether or not such results will be achieved. A number of factors could cause actual results to differ materially from the results expressed or implied by such forward-looking statements or information, including, but not limited to: the Company's ability to finance the development of its mineral properties; assumptions and discount rates being appropriately applied to the PEA, uncertainty as to whether there will ever be production at the Company's mineral exploration and development properties; risks related to the Company's ability to commence production at the Project and generate material revenues or obtain adequate financing for its planned exploration and development activities; uncertainties relating to the assumptions underlying resource and reserve estimates; mining and development risks, including risks related to infrastructure, accidents, equipment breakdowns, labour disputes, bad weather, non-compliance with environmental and permit requirements or other unanticipated difficulties with or interruptions in development, construction or production; the geology, grade and continuity of the Company's mineral deposits; the uncertainties involving success of exploration, development and mining activities; permitting timelines; government regulation of mining operations; environmental risks; unanticipated reclamation expenses; prices for energy inputs, labour, materials, supplies and services; uncertainties involved in the interpretation of drilling results and geological tests and the estimation of reserves and resources; unexpected cost increases in estimated capital and operating costs; the need to obtain permits and government approvals; material adverse changes, unexpected changes in laws, rules or regulations, or their enforcement by applicable authorities; the failure of parties to contracts with the company to perform as agreed; social or labour unrest; changes in commodity prices; and the failure of exploration programs or studies to deliver anticipated results or results that would justify and support continued exploration, studies, development or operations. For a more detailed discussion of such risks and other factors that could cause actual results to differ materially from those expressed or implied by such forward-looking statements, refer to other risks and uncertainties disclosed in the Company’s public filings with Canadian securities regulators, including its most recent annual information form and management’s discussion and analysis, available at www.sedarplus.ca. The forward-looking statements contained in this press release are made as of the date of this press release. Except as required by law, the Company disclaims any intention and assumes no obligation to update or revise any forward-looking statements, whether as a result of new information, future events or otherwise. Additionally, the Company undertakes no obligation to comment on the expectations of, or statements made by, third parties in respect of the matters discussed above.
Non-IFRS/Non-GAAP Financial Performance Measures
The Company has included certain terms or performance measures in this news release that commonly used in the gold mining industry that are not defined under International Financial Reporting Standards ("IFRS") or United States Generally Accepted Accounting Principles ("US GAAP"). This includes: all-in sustaining costs per ounce and cash cost per ounce. Non-IFRS/Non-GAAP financial performance measures do not have any standardized meaning prescribed under IFRS or US GAAP, and therefore, they may not be comparable to similar measures employed by other companies. The data presented is intended to provide additional information and should not be considered in isolation or as a substitute for measures prepared in accordance with IFRS or US GAAP and should be read in conjunction with the Company's financial statements. Because the Company has provided these measures on a forward-looking basis, it is unable to present a quantitative reconciliation to the most directly comparable financial measure calculated and presented in accordance with IFRS or US GAAP without unreasonable efforts. This is due to the inherent difficulty of forecasting the timing or amount of various reconciling items that would impact the most directly comparable forward-looking IFRS or US GAAP measure that have not yet occurred, are outside of the Company's control and/or cannot be reasonably predicted.
Definitions
"All-in sustaining costs" is a non-IFRS or US GAAP financial measure calculated based on guidance published by the World Gold Council ("WGC"). The WGC is a market development organization for the gold industry and is an association whose membership comprises leading gold mining companies. Although the WGC is not a mining industry regulatory organization, it worked closely with its member companies to develop these metrics. Adoption of the all-in sustaining cost metric is voluntary and not necessarily standard, and therefore, this measure presented by the Company may not be comparable to similar measures presented by other issuers. The Company believes that the all-in sustaining cost measure complements existing measures and ratios reported by the Company. All-in sustaining cost includes both operating and capital costs required to sustain gold production on an ongoing basis. Sustaining operating costs represent expenditures expected to be incurred at the Project that are considered necessary to maintain production. Sustaining capital represents expected capital expenditures comprising mine development costs, including capitalized waste, and ongoing replacement of mine equipment and other capital facilities, and does not include expected capital expenditures for major growth projects or enhancement capital for significant infrastructure improvements.
"Cash cost per gold ounce" is a common financial performance measure in the gold mining industry but has no standard meaning under IFRS or US GAAP. The Company believes that, in addition to conventional measures prepared in accordance with IFRS or US GAAP, certain investors use this information to evaluate the Company's performance and ability to generate cash flow. Cash cost figures are calculated in accordance with a standard developed by The Gold Institute. The Gold Institute ceased operations in 2002, but the standard is considered the accepted standard of reporting cash cost of production in North America. Adoption of the standard is voluntary, and the cost measures presented may not be comparable to other similarly titled measures of other companies.
1 The PEA economic analysis was developed using a gold price of $2,175 per ounce. See Table 6 for additional details. All amounts shown in this news release are in United States dollars and metric units of measurement unless otherwise stated.
2 Mineral Resources were estimated based on a gold price of $2,000 per ounce. See Table 1 for additional Mineral Resource modeling input parameters.
Photos accompanying this announcement are available at:
https://www.globenewswire.com/NewsRoom/AttachmentNg/480cd321-e5ce-4daa-b715-53e17b03cf43
https://www.globenewswire.com/NewsRoom/AttachmentNg/53c9111c-9ec7-4cb6-85df-17e47af4afd8
https://www.globenewswire.com/NewsRoom/AttachmentNg/25d3a899-5f83-41a7-abcc-0cfabb6caeb9
https://www.globenewswire.com/NewsRoom/AttachmentNg/5a733e54-5db6-4075-b5ed-4b7763b0ecd4


Figure 1

Overview Map
Figure 2
Annual Gold Production and Cumulative After-Tax Cash Flow
Figure 3

After-Tax IRR Sensitivity Analysis
Figure 4
After-Tax NPV5% Sensitivity Analysis
Distribution channels: Banking, Finance & Investment Industry, Culture, Society & Lifestyle, Mining Industry ...
Legal Disclaimer:
EIN Presswire provides this news content "as is" without warranty of any kind. We do not accept any responsibility or liability for the accuracy, content, images, videos, licenses, completeness, legality, or reliability of the information contained in this article. If you have any complaints or copyright issues related to this article, kindly contact the author above.
Submit your press release